Assignment 3
Objective and Overview
Objective: The objective of this assignment is to practice working with lists, definite loops, the accumulator pattern, and file processing.
Overview: In this assignment, you will write several functions to process a list of numbers and generate the following descriptive statistics: mean, variance, standard deviation, covariance, correlation, and simple regression.
Next, you will write a program to process a data file containing stock price information, calculate stock returns, and generate descriptive statistics about the stocks’ historical rates of return. Finally, you will create a variance-covariance matrix of the stocks’ returns.
Preliminaries
In your work on this assignment, make sure to abide by the collaboration policies of the course.
If you have questions while working on this assignment, please post them on Piazza! This is the best way to get a quick response from your classmates and the course staff.
General Guidelines
-
Refer to the class Coding Standards for important style guidelines. The grader will be awarding/deducting points for writing code that comforms to these standards.
-
Include comments at the top of the file that are similar to the ones that we gave you at the top of
a1task1.py. -
Your functions must have the exact names that we have specified, or we won’t be able to test them. Note in particular that the case of the letters matters (all of them should be lowercase), and that you should use an underscore character (
_) wherever we have specified one (e.g., inconvert_from_inches). -
Each of your functions should include a docstring that describes what your function does and what its inputs are.
-
If a function takes more than one input, you must keep the inputs in the order that we have specified.
-
You should not use any Python features that we have not discussed in class or read about in the textbook.
-
Unless expressly stated, your functions do not need to handle bad inputs – inputs with a type or value that doesn’t correspond to the description of the inputs provided in the problem.
-
Make sure that your functions return the specified value, rather than printing it. Unless it is expressly stated in the problem, none of these functions should use a
printstatement.
Important note regarding test cases and Gradescope:
-
You must test each function after you write it. Here are two ways to do so:
- Run your file after you finish a given function. Doing so will bring you to the Shell, where you can call the function using different inputs and check to see that you obtain the correct outputs.
-
Add test calls to the bottom of your file, inside the
if __name__ == '__main__'control struture. For example:if __name__ == '__main__': print("mystery(6,7) returned", mystery(6,7))
These tests will be called every time that you run the file, which will save you from having to enter the tests yourself. We have given you an example of one such test in the starter file.
-
You must not leave any
printstatements in the global scope. This will cause an error with the Gradescope autograder. Make sure all of yourprintstatements are inside a function scope or insude theif __name__ == '__main__'control struture.
Warm-up Problems
Work on these practice problems before class. We will discuss solutions in class and answer your questions.
-
Write a function
print_squares(numbers)that prints the square of each value in the listnumbers.Example:
>>> print_squares([6,7,8])
36
49
64
Note: no return statement is required
-
Write a function
print_acronym(words)that prints the first letter of each word in a list ofwords.Examples:
>>> print_acronym(['boston', 'university'])
bu
>>> print_acronym(['strawberry', 'fields', 'forever'])
sff
>>> print_acronym(['thank', 'goodness', "it's", 'friday'])
tgif
>>>
Note: to stay on the same line when printing, specify the end argument, i.e.: print(‘foo’,end=’‘)
-
At the console, create the following lists of numbers using the
rangefunction:>>> list(range( , )) [2, 3, 4, 5, 6, 7, 8, 9, 10, 11] >>> list(range( , , )) [0, 7, 14, 21, 28, 35, 42, 49] >>> list(range( , , )) [100, 97, 94, 91, 88, 85, 82, 79, 76, 73, 70, 67, 64, 61, 58, 55, 52, 49, 46, 43, 40, 37, 34, 31, 28, 25, 22, 19, 16, 13, 10, 7, 4, 1]
-
Write a function
find_min(numbers)that processes a list ofnumbers, and returns the minimum value from that list.Examples:
>>> find_min([6])
6
>>> find_min([6,8,5,7,4,9])
4
You may assume there is at least one value in the list.
Hint: use an accumulator variable to hold on to the “minimum so far” as you go through the list of numbers.
-
Write a function
fib(n)that returns a list of the firstnFibonacci numbers. In general, the Fibonacci number F(i) = F(i-1) + F(i-2)Examples:
>>> fib(10)
[0, 1, 1, 2, 3, 5, 8, 13, 21, 34]
>>> fib(20)
[0, 1, 1, 2, 3, 5, 8, 13, 21, 34, 55, 89, 144,
233, 377, 610, 987, 1597, 2584, 4181]
>>> fib(0)
[]
>>> fib(1)
[0]
>>> fib(2)
[0, 1]
Note: use a definite loop, no recursion! Hint: start with special cases for
n == 0orn == 1
Task 1: Descriptive Statistics
50 points; individual-only
Do this task in a file called a3task1.py.
Important Notes
-
You may NOT use any functions or tools from the python
statslibrary,pandas, or similar pre-existing toolkits. The goal of this assignment is for you to practice writing these functions yourself! -
You may use other built-in python functions, including
sumandlen, andlists. -
Unless otherwise specified, you *must use a definite loop with the accumulator to solve each of these problems.
-
Write the function
mean(values), that takes as a parameter a list of numbers, and calculates and returns the mean of those values. The mean is defined as:
For example:
>>> x = [4,4,3,6,7]
>>> mean(x)
4.8
-
Write the function
variance(values), that takes as a parameter a list of numbers, and calculates and returns the population variance of the values in that list. The population variance is defined as: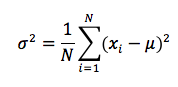
For example:
>>> x = [4,4,3,6,7]
>>> variance(x)
2.16
Notes:
- Your function must use a definite loop and the accumulator pattern to calculate the sum of squared deviations from the mean.
- Re-use your code! You should call your existing
meanfunction from within yourvariancefunction, and store the result in a local variable.
-
Write the function
stdev(values), that takes as a parameter a list of numbers, and calculates and returns the population standard deviation of the values in that list. The population standard deviation is the square-root of the population variance.For example:
>>> x = [4,4,3,6,7]
>>> stdev(x)
1.469693845669907
Notes:
- Re-use your code! You should call your existing
variancefunction from withinstdev. This function does not require the accumulator pattern.
- Re-use your code! You should call your existing
These notes apply to problems 4 through 7.
- The covariance, correlation, r-squared, and regression between two data sets
requires that both data sets be of the same length. Use an assert statement
to test for this condition and print out an error message if the lengths of the
two lists are not the same.
-
Write the function
covariance(x,y)that takes as parameters two lists of values, and calculates and returns the population covariance for those two lists. The population covariance is defined as: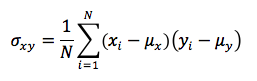
For example:
>>> x = [4,4,3,6,7]
>>> y = [6,7,5,10,12]
>>> covariance(x,y)
3.8
-
Write the function
correlation(x,y)that takes as parameters two lists of values, and calculates and returns the correlation coefficient between these data series. The correlation coefficient is defined as: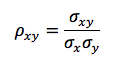
For example:
>>> x = [4,4,3,6,7]
>>> y = [6,7,5,10,12]
>>> correlation(x,y)
0.9915217942181532
>>> correlation(list(range(10)), list(range(10,0,-1)))
-0.9999999999999998
Note about Representational Error
There is a known representational error when working with binary floating-point numbers.
Thus, we will sometimes encounter a result that is arbitrarily close to, but not
exactly the same as we expect to see, such as the value of -0.9999999999999998 above.
We will interpret this value as equal to -1, and we will discuss the idea of an
acceptable margin of error in next week’s assignment.
-
Write the function
rsq(x,y)that takes as parameters two lists of values, and calculates and returns the square of the correlation between those two data series, which is a measure of the goodness of fit measure to explain variation inyas a function of variation ofx.>>> x = [4,4,3,6,7] >>> y = [6,7,5,10,12] >>> rsq(x,y) 0.9831154684095857
Additional Example: we expect no correlation and very low r-square between randomly selected data values. This test uses two lists of random numbers. Notice the very low r-squared.
>>> import random
>>> a = list(range(30))
>>> b = list(range(30))
>>> random.shuffle(a)
>>> random.shuffle(b)
>>> a
[6, 24, 29, 8, 20, 7, 28, 23, 14, 11, 25, 19, 12, 17, 2, 0, 26, 9, 10, 16, 4, 13, 22, 5, 15, 18, 21, 1, 27, 3]
>>> b
[17, 22, 25, 29, 27, 7, 11, 19, 26, 16, 0, 9, 21, 18, 3, 24, 8, 10, 20, 4, 13, 6, 28, 14, 2, 5, 23, 12, 15, 1]
>>> correlation(a,b)
0.12880978865406006
>>> rsq(a,b)
0.016591961653103622
-
Write the function
simple_regression(x,y)that takes as parameters two lists of values, and calculates and returns the regression coefficients between these data series. The function should return alistcontaining two values: the intercept and regression coefficients, α and β.The regression coefficient and intercept are defined as:

For example:
>>> x = [4,4,3,6,7]
>>> y = [6,7,5,10,12]
>>> simple_regression(x,y)
(-0.44444444444444287, 1.759259259259259)
Task 2: Stock Returns and Statistics
50 points; individual-only
Preliminaries
Obtaining Stock Price Data
You will download stock price data files to use in your project. There will be a demonstration of how to obtain these files from Yahoo Finance during class on Wednedsay 8/19.
-
You should download 10 years of daily price data for at least 3 stocks. You may choose any stocks that you like, provided they have at least 10 years of data. Here are some recommendations: AAPL, BAC, GOOG, HD, KO, MMM, MSFT, PM, XOM.
-
You should also download data for the stock market as a whole. I recommend that you use the ticker symbol SPY (which is an Exchange Traded Fund that tracks the S&P 500 Index), or VTSMX (Vanguard’s total market index mutual fund).
-
Save the
.csvfiles to the same directory in which you save your Python code files.
Do this task in a file called a3task2.py.
-
Write a function
calc_returns(prices). This function will process a list of stock prices and calculate the periodic returns. The function should assume that the oldest price is inprices[0]and latest price inprices[-1]. The function should use a loop and accumulator pattern to accumulate a list of returns for periods 1 to n – there is no return for period 0.The periodic rate of return is calculated as the rate of change in price from the previous period, i.e.,

For example:
>>> prices = [100,110,105,112,115]
>>> returns = calc_returns(prices)
>>> print(returns)
[0.10000000000000009, -0.045454545454545414, 0.06666666666666665, 0.02678571428571419]
Notes:
-
For N stock prices, you will generate a list of N-1 periodic returns.
-
The function
calc_pricesshould not print any output, but rather creates and returns alistof periodic rates of return. -
When computing with binary floating point numbers, there is a small representational error which might result in an unexpected value in the insignificant digits (e.g.,
(110 - 100) / 100gave a result of0.10000000000000009.) Do not be alarmed by this small error! -
The values in the list of returns will be unformatted floating-point numbers; we’ll do the formatting part later in a separate function.
-
-
Write a function
process_stock_prices_csv(filename). This function will process a data file containing stock price data, and return a list of stock prices.The format of the file is that each line is a discrete record. The lines in this file are in CSV (“Comma Separated Values”) format. Here is an sample CSV file containing stock prices:
    Date,Open,High,Low,Close,Adj Close,Volume
    2012-01-10,60.844284,60.857143,60.214287,60.462856,54.395779,64549100
    2012-01-11,60.382858,60.407143,59.901428,60.364285,54.307095,53771200
    2012-01-12,60.325714,60.414288,59.821430,60.198570,54.158012,53146800
    2012-01-13,59.957142,60.064285,59.808571,59.972858,53.954945,56505400
    2012-01-17,60.599998,60.855713,60.422855,60.671429,54.583416,60724300
The first row contains header information, which we will discard. Each line after the first line is a record for one date. For this assignment, we only care about the next-to-last value (“Adj Close”), which is the adjusted close price on that date.
Your function should return the stock prices as a
list. Here is an algorithm to process this CSV file:- Create an empty list to hold the prices (i.e., set a list as an accumulator variable).
- Open the file for reading using the built-in function
open(filename). - Read and discard the first line (i.e., the headers).
- Use a for loop to process the rest of the file. For every remaining line in the file,
parse that line to obtain the last element, which is the price. Convert this price
into a floating-point number (
float), and append it to the list.
Here is an example of client code to run this file. Note that the filename will depend on where you save the file on your computer. This filename works for my computer only!
>>> filename = './AAPL.csv'
>>> prices = process_stock_prices_csv(filename)
>>> # prices is now a list containing the only adjusted closing prices for each day.
-
Write a function
stock_report(filenames)as a client program to process stock prices and display descriptive statistics about the stocks. This program will process the list offilenames, each of which is a .CSV file containing stock price data in the Yahoo Finance format (for the same time periods), as well as the the stock market index (^SPC). The finished version of the function must return a string containing the entire report, i.e., several outputs, neatly formatted, etc.Your client program should do the following tasks for each stock:
-
Use your function
process_stock_prices_csvto read the stock price data from the file, and obtain alistcontaining only the stock prices (no other fields). -
Calculate the stock returns by calling your
calc_returns(prices)on thelistof the stock’s prices to obtain a list of returns. -
Find the mean and standard deviation of returns, and print them out in a nicely formatted table. You should re-use your functions from Task 1. It would be helpful to import your functions from Task 1, using this line:
from a3task1 import *
which will give you access to all of your statistical functions from Task 1.
We want to compare each stock to the stock market index (use SPY for the SPY 500 index), to see how this stock might affect a portfolio’s expected return. (If you are not familiar with it, here is a brief reading about the Capital Asset Pricing Model).
You will use your functions from Task 1 to find the covariance with the market return (SPY or ^SPC or VTSMX), the correlation coefficient, the r-square statistic, and the regression coefficients (beta describes this stocks’ market risk, i.e., how much this stock’s return varies in relation to the market as a whole).
Finally, your function should create a report that is well-formatted. You may decide what kind of formatting looks good to you, but here is a sample:
    >>> filenames = ['AAPL.csv', 'GOOG.csv', 'IBM.csv', 'SPY.csv']
    >>> stock_report(filenames) # note, this function will return a string
    '''
    Calculated returns for 4 stocks.

    Descriptive statistics for daily stock returns:
    Symbol:       AAPL       GOOG        IBM        SPY
    Mean:       0.00107    0.00062    0.00035    0.00041
    StDev:      0.01972    0.01848    0.01391    0.01281
    Covar:      0.00015    0.00015    0.00012    0.00016
    Correl:     0.60966    0.64289    0.69672    1.00000
    R-SQ:       0.37169    0.41331    0.48542    1.00000
    Beta:       0.39625    0.44585    0.64166    1.00000
    Alpha:     -0.00001    0.00013    0.00018    0.00000
    '''
Hints/Notes:
-
This sample uses daily return data. Your results will differ from the sample output! This is expected. The daily mean return will be approximately 1/250 of the annual return, and the daily standard deviation will be approximately 1/sqrt(250) of the annual standard deviation.
-
This code assumes that the “market reference” (
SPY) is the last.csvfile in the list. You should do the same. -
Before trying to build this table, call each of the statistical functions and save the result in a variable. While you are testing, you should
printout the variables to ensure you know each function works. -
Build the table one line at a time, using string concatenation (i.e.,
+=). When the function is done, return the string. The finished function shuold not print! -
This sample uses number formatting to limit the number of digits after the decimal point. Read about it in the .PPT slides from class.
-
Submitting Your Work
Log in to GradeScope to submit your work.
Be sure to name your files correctly!
Under the heading for Assignment 3, attach each of the required files to your submission.
When you upload the files, the autograder will test your functions/programs.
Notes:
- You must upload your
.csv(stock price data files) as well as your.pyfiles. - You may resubmit multiple times, but only the last submission will be graded.
Warnings about Submissions
-
Make sure to use these exact file names, or Gradescope will not accept your files. If Gradescope reports that a file does not have the correct name, you should rename the file using the name listed in the assignment page.
-
If you make any last-minute changes to one of your Python files (e.g., adding additional comments), you should run the file in Spyder after you make the changes to ensure that it still runs correctly. Even seemingly minor changes can cause your code to become unrunnable.
-
If you submit an unrunnable file, Gradescope will accept your file, but it will not be able to auto-grade it. If time permits, you are strongly encouraged to fix your file and resubmit. Otherwise, your code will fail most if not all of our tests.
Important note regarding test cases and Gradescope:
-
You must test each function after you write it. Here are two ways to do so:
- Run your file after you finish a given function. Doing so will bring you to the Shell, where you can call the function using different inputs and check to see that you obtain the correct outputs.
-
Add test calls to the bottom of your file, inside the
if __name__ == '__main__'control structure. For example:if __name__ == '__main__': print("mystery(6,7) returned", mystery(6,7))
These tests will be called every time that you run the file, which will save you from having to enter the tests yourself. We have given you an example of one such test in the starter file.
-
You must not leave any
printstatements in the global scope. This will cause an error with the Gradescope autograder. Make sure all of yourprintstatements are inside a function scope or insude theif __name__ == '__main__'control structure.