Assignment 9
Objective and Overview
Objective: Become familiar with the backtesting methodology as a way to evaluate an
investing/trading strategy. Additional practice with the pandas package in Python.
Overview: In this assignment, you will develop some additional experience with
backtesting an investment strategy. You will use the pandas.DataFrame object for
managing time-series and panel data.
Background: Before trading on an investment strategy with real money, savvy investors want to “backtest”, by seeing how it would have performed historically.
-
Read about backtesting in general on Investopedia.
-
Experiment with this Portfolio Visualizer Backtesting Tool. This tool allows you to create a static portfolio of stocks/asset classes and to visualize how that portfolio behaved historically compared to a benchmark such as an unmanaged index. What this tool does not do is to let you implement a trading rule that will change your portfolio based changes in the underlying stock prices.
Preliminaries
In your work on this assignment, make sure to abide by the collaboration policies of the course.
For each problem in this problem set, we will be writing or evaluating some Python code. You are encouraged to use the Spyder IDE which will be discussed/presented in class, but you are welcome to use another IDE if you choose.
If you have questions while working on this assignment, please post them on Piazza! This is the best way to get a quick response from your classmates and the course staff.
Important Guidelines: Comments and Docstrings
-
Refer to the class Coding Standards for important style guidelines. The grader will be awarding/deducting points for writing code that comforms to these standards.
-
Every program file must begin with a descriptive header comment that includes your name, username/BU email, and a brief description of the work contained in the file.
-
Every function must include a descriptive docstring that explains what the function does and identifies/defines each of the parameters to the function.
Task 1: Bollinger Bands and Backtesting a Trading Strategy
50 points; individual-only
In this task, you will implement a simple backtesting program. The objective of this program is to test some technical analysis (i.e., charting) trading strategies. In particular, you will develop functions to analyze some historical asset (e.g., stock) prices or other metrics, and create some trading rule based on those metrics. Next, you will write a functon to calculate returns using this trading rule. Finally, you will “back-test” your trading strategy against historical price data.
To begin, you will analyze a data set of historical price data.
Based on this data, you will create Bollinger Bands, which are
upper and lower bounds around some moving-average metric.
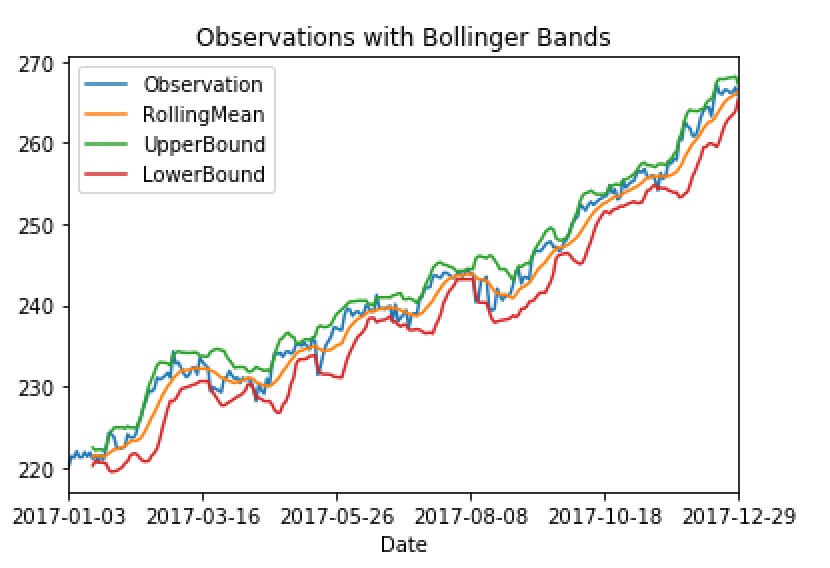
For example, here is a graph showing the historical prices from the SPY exchange-traded
fund (Observations), along with the 21-day moving average price (RollingMean),
and the LowerBound and UpperBound that are created by using the 21-day moving
average price and 21-day moving average standard deviation of price:
Do this entire task in a file called a9task1.py.
-
Write the function
create_bollinger_bands(df, window = 21, no_of_std = 1, column_name = '')that will create Bollinger bands.The parameters are:
df, apandas.DataFrameobject containing one or more columns of numerical data observations with which to create the Bollinger Bands.window, the number of days to use in creating the rolling mean and standard deviation.
no_of_std, the number of standard deviations to use in calculating the Bollinger bands.
column_name, which is the name of the column to use from theDataFrame df. If not provided, use the first column of from theDataFrame.The function returns a
pandas.DataFramewith the sameindexas the parameterdf, containing the columns:['Observations', 'RollingMean', 'LowerBound', 'UpperBound']Here is a sample call to this function and a demonstration of the data returned:
>>> # read a csv file
>>> df = pd.read_csv('/Users/azs/Downloads/SPY-daily.csv')
>>> df.index = df['Date']
>>> # obtain only a one-year slice:
>>> df = df.loc['2017-01-01':'2017-12-31']
>>> df.tail()
                  Date        Open        High         Low       Close    Adj Close    Volume
Date
2017-12-22  2017-12-22  267.600006  267.640015  266.899994  267.510010   266.442871  78720900
2017-12-26  2017-12-26  267.049988  267.440002  266.890015  267.190002   266.124146  45244400
2017-12-27  2017-12-27  267.380005  267.730011  267.010010  267.320007   266.253632  57751000
2017-12-28  2017-12-28  267.890015  267.920013  267.450012  267.869995   266.801422  45116100
2017-12-29  2017-12-29  268.529999  268.549988  266.640015  266.859985   265.795441  96007400

>>> bb = create_bollinger_bands(df, window = 10, no_of_std = 2, column_name = 'Adj Close')
>>> bb.tail()
            Observation  RollingMean  UpperBound  LowerBound
Date
2017-12-22   266.442871   265.345413  267.941939  262.748887
2017-12-26   266.124146   265.567954  267.988946  263.146961
2017-12-27   266.253632   265.756867  268.052049  263.461684
2017-12-28   266.801422   266.003531  268.144457  263.862605
2017-12-29   265.795441   266.257611  267.236123  265.279099

>>> bb.plot() # creates the plot shown above
Notes:
-
Create a new
pandas.DataFrameto hold the results of this function. Do not modify the parameterdf. -
All of the parameters other than
dfare optional, with default values supplied. That is, you could call the function as:>>> bb = create_bollinger_bands(df) # using default parameters
-
If the
column_nameis supplied, use that column from thedf. For example:>>> bb = create_bollinger_bands(df, window = 10, no_of_std = 2, column_name = 'High') >>> bb.tail() Observation RollingMean UpperBound LowerBound Date 2017-12-22 267.640015 267.701004 269.183925 266.218084 2017-12-26 267.440002 267.807004 268.991833 266.622175 2017-12-27 267.730011 267.848004 268.985359 266.710649 2017-12-28 267.920013 267.884006 269.003494 266.764517 2017-12-29 268.549988 268.017005 269.101351 266.932658 -
If
column_namewas NOT supplied, use the first (left most) column. For example:>>> # create a 1-column DataFrame >>> df = pd.DataFrame(index=df.index, data = df['Close']) >>> df.tail() Close Date 2017-12-22 267.510010 2017-12-26 267.190002 2017-12-27 267.320007 2017-12-28 267.869995 2017-12-29 266.859985 >>> bb = create_bollinger_bands(df) # using default parameters >>> bb.tail() Observation RollingMean UpperBound LowerBound Date 2017-12-22 267.510010 265.013811 267.308139 262.719484 2017-12-26 267.190002 265.339050 267.414322 263.263779 2017-12-27 267.320007 265.676669 267.431138 263.922200 2017-12-28 267.869995 265.914764 267.607485 264.222044 2017-12-29 266.859985 266.112383 267.647127 264.577639
Another Example
Here is another example, which produces Bollinger bands based on 1 standard deviation around the 30-day moving average volume:
>>> df = pd.read_csv('/Users/azs/Downloads/SPY-daily.csv')
>>> df.index = df['Date']
>>> df = df.loc['2017-09-01':'2017-12-31']
>>> bb = create_bollinger_bands(df, window = 30, no_of_std = 1, column_name = 'Volume')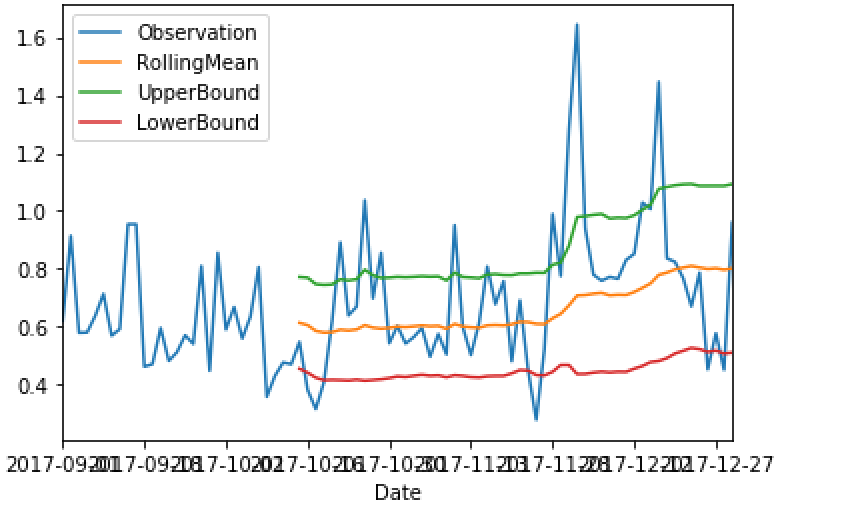
-
-
Write the function
create_long_short_position(df).The parameter
dfwill be apandas.DataFrameobject with the columns:['Observations', 'RollingMean', 'LowerBound', 'UpperBound'].This function will evaluate the data elements in the
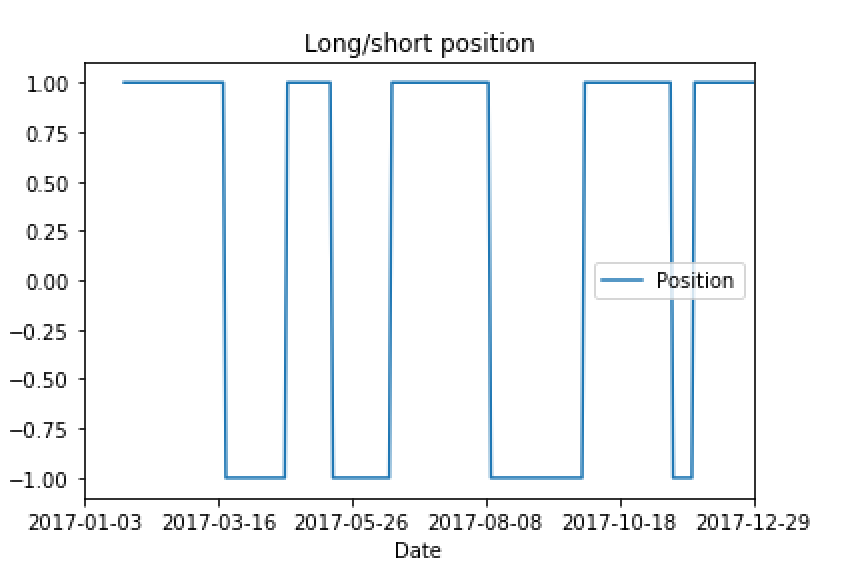
Observationcolumn against the Bollinger bands in the columnsUpperBoundandLowerBound. The function will apply a long/short strategy, i.e., create a long position (+1) when theObservationcrosses above theUpperBound, and create a short position (-1) when theObservationcrosses below theLowerBound.The function will return a new
pandas.DataFrameobject with the sameindexas the parameterdf, containing a columnPosition.Here is an example of this function:
>>> # read a csv file
>>> df = pd.read_csv('/Users/azs/Downloads/SPY-daily.csv')
>>> df.index = df['Date']
>>> # obtain only a one-year slice:
>>> df = df.loc['2017-01-01':'2017-12-31']
>>> bb = create_bollinger_bands(df, window = 10, no_of_std = 2, column_name = 'Adj Close')
>>> position = create_long_short_position(bb)
>>> position.plot()
The above example produces this graph:
Notes:
-
Create a new
pandas.DataFrameto hold the results of this function. Do not modify the parameterdf. -
Notice that the contents of the
DataFrameobjectpositionis a single column, with values of either+1or-1.
-
-
Write the function
calculate_long_short_returns(df, position, column_name = '').The parameters are:
df, apandas.DataFrameobject with an asset price data series,
position, apandas.DataFrameobject with the sameindexas the parameterdf, containing a column ‘Position’,
column_name, which is the column to use from theDataFrame, containing the asset prices. If not provided, use the first column of from theDataFrame.The function returns a
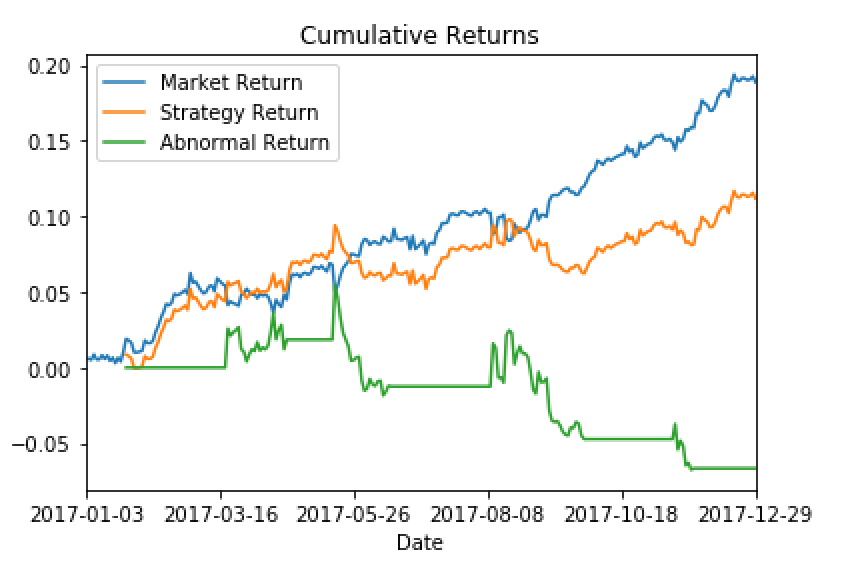
pandas.DataFrameobject containing the columns['Market Return', 'Strategy Return', and 'Abnormal Return']Here is an example of using this function:
>>> # read a csv file
>>> df = pd.read_csv('/Users/azs/Downloads/SPY-daily.csv')
>>> df.index = df['Date']
>>> # obtain only a one-year slice:
>>> df = df.loc['2017-01-01':'2017-12-31']
>>> bb = create_bollinger_bands(df, 10, 2, 'Adj Close')
>>> position = create_long_short_position(bb)
>>> returns = calculate_long_short_returns(df, position, 'Adj Close')
>>> returns.plot()
The above example produces this graph:

Notes:
- Create a new
pandas.DataFrameto hold the results of this function. Do not modify the parameterdf.
- Create a new
-
Write the function
plot_cumulative_returns(df), which will create a plot of the cumulative return for each column in the parameterdf, apandas.DataFrameobject with one or more series of returns. The function does not return any values.For example, this sequence of operations:
>>> # read a csv file
>>> df = pd.read_csv('/Users/azs/Downloads/SPY-daily.csv')
>>> df.index = df['Date']
>>> # obtain only a one-year slice:
>>> df = df.loc['2017-01-01':'2017-12-31']
>>> bb = create_bollinger_bands(df, 10, 2, 'Adj Close')
>>> position = create_long_short_position(bb)
>>> returns = calculate_long_short_returns(df, position, 'Adj Close')
>>> plot_cumulative_returns(returns)
Produces this graph:
Task 2: Backtesting your own Trading Strategy
*50 points; individual-only (this part is not autograded)
You are given total lattitude and flexibility about how to structure this task.
Write whichever functions (or objects/methods) you believe are helpful to organize
your work. Name the functions and variables appropriately, and write good docstrings
and comments.
Your work will be graded for the correctness of applying the backtesting methodology, as well as for good implementation and code documentation, but not for proving a valuable trading strategy. That is, you might discover that a strategy is NOT valuable, and that’s OK!
Do all of your work in a file called a9task2.py.
To begin, you must formulate a hypothesis of a strategy that you think will be valuable.
Here are some ideas you can investigate:
-
Buying or selling a stock (or index) based on some macro economic factor, e.g., interest rates, oil prices, employment numbers, etc.
-
Rebalancing a portfolio based on value changes (for example, to maintain a 50/50 investment between two stocks, or between stocks and cash), or to sell 1% of your position every time the stock goes up, and buy 1% every time the stock goes down.
You may pick any reasonable strategy you would like to explore, but if it is not one of the above ideas, please check in with me before you begin so we can confirm that it is viable to test.
Data Gathering
Data sources to consider:
-
Historical stock prices: https://www.investing.com/equities/
-
Historical commodities prices: https://www.investing.com/commodities/
-
Historical interest rates: https://www.investing.com/rates-bonds/
-
Historical currency exchange rates: https://www.investing.com/currencies
You are responsible for gathering whatever data you want to use.
- Save any
.csvfiles to the same directory in which you save your Python code files, and plan to upload them with your Python code.
If you use any other (non-CSV) data, for example earnings per share or dividends, you should document your source as a comment inside your code file.
Assumptions
You may make any reasonable assumptions, but your must document them clearly in your docstrings and/or report.
Here are some baseline assumptions that you may make for this assignment without additional documentation:
-
You may buy fractional shares as needed.
-
No restrictions on short-selling and no margin requirements.
-
No taxes.
-
Trading fees or commissions: make your calculations two ways:
- once, without trading fees or commissions;
- a second time with EITHER a fixed $10 commission per trade, or else a 0.25% trading fee (i.e., the bid-ask spread) each time you buy or sell.
You may NOT assume a time-machine (i.e., you cannot look at the returns and then go back and buy the stocks that will perform well).
Creating a Trading Rule
Your strategy should be clearly articulated with a buy/sell type of rule. You will begin by evaluating some data, and from it decide to buy, sell, or rebalance your portfolio.
To implement your trading rule, you will need to:
-
Create a “signal” as a column within your
pd.DataFramethat you will set based on the data (e.g., stock prices/returns) in some other column in thepd.DataFrame. For example, when XYZ stock does A, we will buy. When XYZ stock does B, we will sell. You may use a loop to process the underlying data to set this “signal”. -
Create one or more columns in which you will calculate the investment action(s) taken in response to the “signal”, as well as the daily rate of return earned by your strategy. As examples:
-
If you buy a stock, you will earn it’s rate of return.
-
If you sell (short) a stock, you will earn the negative of its rate of return.
-
If you create an asset allocation, you will calculate the weights in each asset based on the “signal”, and then calculate the weighted average rate of return based on those weights.
-
-
Calculate the “normal return” or market return (a benchmark against which to compare your strategy. This might be as simple as the rate of return on a buy-and-hold strategy in the reference stock or index. Store this result in a column in a
pd.DataFrame. -
Calculate the “abnormal return” of your strategy compared to the benchmark’s rate of return (the “normal return”). Store this result in a column in a
pd.DataFrame. -
Create one or more beautifully-formatted and labeled graphs to illustrate your
strategy as compared to the benchmark (i.e., market returns vs. your strategy returns), as well abnormal returns. -
Compute descriptive statistics to illustrate how your strategy performed in terms of mean rate of return and standard deviation of returns, as well as the cumulative abnormal returns.
Report
Write a brief report (one paragraph is sufficient) to explain your strategy and your results. Include graphs (see example above) to illustrate your strategy’s daily performance vs. your benchmark, as well as your cumulative abnormal returns.
Take a screen shot of your graphs!
The Gradescope autograder cannot display/test your graphs. Instead, we will attempt to run your code manually to test the graphing.
As a backup, please take screen shots of your graphs and save as a single .pdf
file called a9graphs.pdf and attach this file to Gradescope.
To take a screen shot:
-
On Mac: use the keyboard sequence
Command-Shift-4, and then drag the cross-hairs to include the region you want to include. The image will be saved to your desktop. Create a Word document and drag your images into the document, then save as.pdf. -
On Windows: use the
Snipping Toolto create a screen shot for the desired area. Create a Word document and paste your images into the document, then save as.pdf.
Submitting Your Work
Use the link to GradeScope (left) to submit your work.
Be sure to name your files correctly!
Under the heading for Assignment 9, attach these 3 required files:
a9task1.py, a9task2.py and a9graphs.pdf. In addition, please upload:
* All .csv data files used by your program.
-
A
transcript.txtfile containing the text output that your program generated at the Python console. -
A brief report (.pdf) summarizing your backtest and results. Include screen-shots of all graphs that you produce.
Notes:
- You may resubmit multiple times, but only the last submission will be graded.