Assignment 3 - Descriptive Statistics for Stock Investors
Discussion on Monday 2/2/26
Workshop in class on Wednesday 2/4/26
Submission due by 9:00 p.m. on Friday 2/6/26.
Preliminaries
In your work on this assignment, make sure to abide by the collaboration policies of the course.
For each problem in this problem set, we will be writing or evaluating some Python code. You are encouraged to use the Spyder IDE which will be discussed/presented in class, but you are welcome to use another IDE if you choose.
If you have questions while working on this assignment, please post them on Piazza! This is the best way to get a quick response from your classmates and the course staff.
Programming Guidelines
-
Refer to the class Coding Standards for important style guidelines. The grader will be awarding/deducting points for writing code that comforms to these standards.
-
Every program file must begin with a descriptive header comment that includes your name, username/BU email, and a brief description of the work contained in the file.
-
Every function must include a descriptive docstring that explains what the function does and identifies/defines each of the parameters to the function.
-
Your functions must have the exact names specified below, or we won’t be able to test them. Note in particular that the case of the letters matters (all of them should be lowercase), and that some of the names include an underscore character (
_). -
Make sure that your functions return the specified value, rather than printing it. None of these functions should use a
printstatement. -
If a function takes more than one input, you must keep the inputs in the order that we have specified.
-
You should not use any Python features that we have not discussed in class or read about in the textbook.
-
Your functions do not need to handle bad inputs – inputs with a type or value that doesn’t correspond to the description of the inputs provided in the problem.
-
You must test each function after you write it.
Warnings: Individual Work, Generative AI, and Academic Conduct!!
-
This is an individual assignment. You may discuss the problem statement/requirements, Python syntax, test cases, and error messages with your classmates. However, each student must write their own code without copying or referring to other student’s work.
-
It is strictly forbidden to use any code that you find from online websites including but not limited to as CourseHero, Chegg, or any other sites that publish homework solutions.
-
It is strictly forbidden to use any generative AI (e.g., ChatGPT, Claude, Gemini, CoPilot or any similar tools**) to write solutions for any assignment.
Students who submit work that is not authentically their own individual work will earn a grade of 0 on this assignment and a reprimand from the office of the Dean.
If you have questions while working on this assignment, please post them on Piazza! This is the best way to get a quick response from your classmates and the course staff.
Overview
The objective of this assignment is to practice working with lists, definite loops, the accumulator pattern, and file processing.
In this assignment, you will write several functions to process a list of numbers and generate the following descriptive statistics: mean, variance, standard deviation, covariance, correlation, and simple regression. Next, you will write a program to process a data file containing stock price information, calculate stock returns, and generate descriptive statistics about the stocks’ historical rates of return. Finally, you will create a variance-covariance matrix of the stocks’ returns.
Task 1: Descriptive Statistics
40 points; individual-only
Do this task in a file called a3task1.py.
-
Write the function
mean(values), that takes as a parameter a list of numbers, and calculates and returns the mean of those values. The mean is defined as: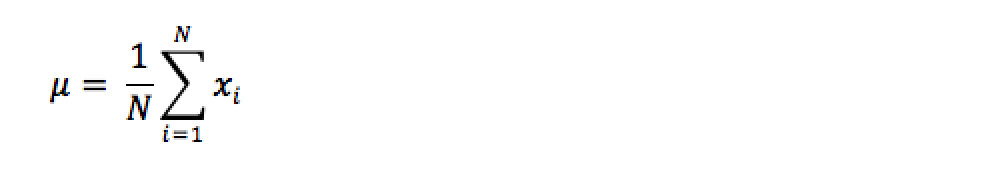
For example:
>>> x = [4,4,3,6,7]
>>> mean(x)
4.8
-
Write the function
variance(values), that takes as a parameter a list of numbers, and calculates and returns the population variance of the values in that list. The population variance is defined as: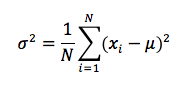
For example:
>>> x = [4,4,3,6,7]
>>> variance(x)
2.16
Notes:
- Your function must use a definite loop and the accumulator pattern to calculate the sum of squared deviations from the mean.
- Re-use your code! You should call your existing
meanfunction from within yourvariancefunction, and store the result in a local variable.
-
Write the function
stdev(values), that takes as a parameter a list of numbers, and calculates and returns the population standard deviation of the values in that list. The population standard deviation is the square-root of the population variance.For example:
>>> x = [4,4,3,6,7]
>>> stdev(x)
1.469693845669907
Notes:
- Re-use your code! You should call your existing
variancefunction from withinstdev. This function does not require the accumulator pattern.
- Re-use your code! You should call your existing
These notes apply to problems 4 through 7.
- The covariance, correlation, r-squared, and regression between two data sets
requires that both data sets be of the same length. Use an assert statement
to test for this condition and print out an error message if the lengths of the
two lists are not the same.
-
Write the function
covariance(x,y)that takes as parameters two lists of values, and calculates and returns the population covariance for those two lists. The population covariance is defined as:
For example:
>>> x = [4,4,3,6,7]
>>> y = [6,7,5,10,12]
>>> covariance(x,y)
3.8
-
Write the function
correlation(x,y)that takes as parameters two lists of values, and calculates and returns the correlation coefficient between these data series. The correlation coefficient is defined as: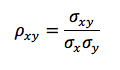
For example:
>>> x = [4,4,3,6,7]
>>> y = [6,7,5,10,12]
>>> correlation(x,y)
0.9915217942181532
>>> correlation(list(range(10)), list(range(10,0,-1)))
-0.9999999999999998
Note about Representational Error
There is a known representational error when working with binary floating-point numbers.
Thus, we will sometimes encounter a result that is arbitrarily close to, but not
exactly the same as we expect to see, such as the value of -0.9999999999999998 above.
We will interpret this value as equal to -1, and we will discuss the idea of an
acceptable margin of error in next week’s assignment.
-
Write the function
rsq(x,y)that takes as parameters two lists of values, and calculates and returns the square of the correlation between those two data series, which is a measure of the goodness of fit measure to explain variation inyas a function of variation ofx.>>> x = [4,4,3,6,7] >>> y = [6,7,5,10,12] >>> rsq(x,y) 0.9831154684095857
Additional Example: we expect no correlation and very low r-square between randomly selected data values. This test uses two lists of random numbers. Notice the very low r-squared.
>>> import random
>>> a = list(range(30))
>>> b = list(range(30))
>>> random.shuffle(a)
>>> random.shuffle(b)
>>> a
[6, 24, 29, 8, 20, 7, 28, 23, 14, 11, 25, 19, 12, 17, 2, 0, 26, 9, 10, 16, 4, 13, 22, 5, 15, 18, 21, 1, 27, 3]
>>> b
[17, 22, 25, 29, 27, 7, 11, 19, 26, 16, 0, 9, 21, 18, 3, 24, 8, 10, 20, 4, 13, 6, 28, 14, 2, 5, 23, 12, 15, 1]
>>> correlation(a,b)
0.12880978865406006
>>> rsq(a,b)
0.016591961653103622
-
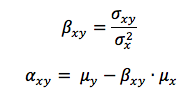
Write the function
simple_regression(x,y)that takes as parameters two lists of values, and calculates and returns the regression coefficients between these data series. The function should return alistcontaining two values: the intercept and regression coefficients, α and β.The regression coefficient and intercept are defined as:
For example:
>>> x = [4,4,3,6,7]
>>> y = [6,7,5,10,12]
>>> simple_regression(x,y)
(-0.44444444444444287, 1.759259259259259)
Task 2: Stock Returns and Statistics
40 points; individual-only
Preliminaries
Obtaining Stock Price Data
You will download stock price data files to use in your project. There will be a demonstration of how to obtain these files from Google Finance during class on Monday 2/3.
-
You should download 1 year of daily price data for at least 3 stocks. You may choose any stocks that you like, but it is recommended that you choose some established companies whose stocks have traded for many years. Here are some recommendations: AAPL, BAC, GOOG, HD, KO, MMM, MSFT, PM, XOM.
-
You should also download data for the stock market as a whole. I recommend that you use the ticker symbol SPY (which is an Exchange Traded Fund that tracks the S&P 500 Index), or ^SPC (S&P 500 Index) or VTSMX (Vanguard’s total market index mutual fund).
-
In Google Sheets, use the
GOOGLEFINANCEfunction, for example:=GOOGLEFINANCE("AAPL","all", "2025-01-01", "2026-01-01") -
In Excel, you can use the
STOCKHISTORYfunction, for example:=STOCKHISTORY("AAPL","2025-01-01","2026-01-01",0,1, 0,1,2,3,4,5) -
Save the
.csvfiles to the same directory in which you save your Python code files.
Video Example: Processing a CSV data file.
Here is a video example that demonstrates how to read a file in Python, and how
to process a .CSV data file using a for loop and list indexing.
Do this task in a file called a3task2.py.
-
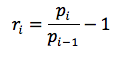
Write a function
calc_returns(prices). This function will process a list of stock prices and calculate the periodic returns. The function should assume that the oldest price is inprices[0]and latest price inprices[-1]. The function should use a loop and accumulator pattern to accumulate a list of returns for periods 1 to n – there is no return for period 0.The periodic rate of return is calculated as the rate of change in price from the previous period, i.e.,
For example:
>>> prices = [100,110,105,112,115]
>>> returns = calc_returns(prices)
>>> print(returns)
[0.10000000000000009, -0.045454545454545414, 0.06666666666666665, 0.02678571428571419]
Notes:
-
For N stock prices, you will generate a list of N-1 periodic returns.
-
The function
calc_pricesshould not print any output, but rather creates and returns alistof periodic rates of return. -
When computing with binary floating point numbers, there is a small representational error which might result in an unexpected value in the insignificant digits (e.g.,
(110 - 100) / 100gave a result of0.10000000000000009.) Do not be alarmed by this small error! -
The values in the list of returns will be unformatted floating-point numbers; we’ll do the formatting part later in a separate function.
-
-
Write a function
process_stock_prices_csv(filename). This function will process a data file containing stock price data, and return a list of stock prices.The format of the file is that each line is a discrete record. The lines in this file are in CSV (“Comma Separated Values”) format. Here is an sample CSV file containing stock prices:
    Date,Open,High,Low,Close,Adj Close,Volume
    2012-01-10,60.844284,60.857143,60.214287,60.462856,54.395779,64549100
    2012-01-11,60.382858,60.407143,59.901428,60.364285,54.307095,53771200
    2012-01-12,60.325714,60.414288,59.821430,60.198570,54.158012,53146800
    2012-01-13,59.957142,60.064285,59.808571,59.972858,53.954945,56505400
    2012-01-17,60.599998,60.855713,60.422855,60.671429,54.583416,60724300
The first row contains header information, which we will discard. Each line after the first line is a record for one date. For this assignment, we only care about the next-to-last value (“Adj Close”), which is the adjusted close price on that date.
Your function should return the stock prices as a
list. Here is an algorithm to process this CSV file:- Create an empty list to hold the prices (i.e., set a list as an accumulator variable).
- Open the file for reading using the built-in function
open(filename). - Read and discard the first line (i.e., the headers).
- Use a for loop to process the rest of the file. For every remaining line in the file,
parse that line to obtain the next-to-last element, which is the price. Convert this price
into a floating-point number (
float), and append it to the list.
Here is an example of client code to run this file. Note that the filename will depend on where you save the file on your computer. This filename works for my computer only!
>>> filename = './AAPL-daily.csv'
>>> prices = process_stock_prices_csv(filename)
>>> # prices is now a list containing the adjusted closing prices for each day.
-
Write a function
stock_descriptive_statistics(filenames)as a client program to process stock prices and display (print out) descriptive statistics about the stocks. The function takes a parameterfilenameswhich is a list of CSV filenames with stock price history, in the format as above.This program will process several CSV files to obtain stock prices (for the same time periods) for a market index (for example, SPY), as well as 3 other stocks, and produce several outputs. Here is a sample function call:
>>> filenames = ['SPY.csv', 'AAPL.csv', 'AMZN.csv', 'NKE.csv']
>>> stock_descriptive_statistics(filenames)
And here is some sample output corresponding to this function call:
Symbol:     SPY        AAPL       AMZN       NKE
Mean:       0.00041    0.00107    0.00128    0.00087
StDev:      0.01281    0.01972    0.02429    0.01793
Covar:      0.00016    0.00015    0.00018    0.00015
Correl:     1.00000    0.60966    0.57056    0.64060
R-SQ:       1.00000    0.37169    0.32554    0.41036
Beta:       1.00000    0.93802    1.08165    0.89625
Alpha:      0.00000    0.00068    0.00084    0.00051
Your client program should do the following tasks for each file (stock):
- Use your function
process_stock_prices_csvto read the stock price data from the file, and obtain alistcontaining only the stock prices (no other fields). - Calculate the stock returns by calling your
calc_returns(prices)on thelistof the stock’s prices to obtain a list of returns. -
Find the mean and standard deviation of returns, and print them out in a nicely formatted table. You should re-use your functions from Task 1. It would be helpful to import your functions from Task 1, using this line:
from a3task1 import *
which will give you access to all of your statistical functions from Task 1.
We want to compare each stock to the stock market index (use any one of SPY or ^SPC or VTSMX), to see how this stock might affect a portfolio’s expected return. (If you are not familiar with it, here is a brief reading about the [Capital Asset Pricing Model][capm]).
You will use your functions from Task 1 to find the covariance with the market return (e.g., SPY or ^SPC or VTSMX), the correlation coefficient, the r-square statistic, and the regression coefficients (beta describes this stocks’ market risk, i.e., how much this stock’s return varies in relation to the market as a whole).
Finally, your function should create a report that is well-formatted, with columns lining up similar to the example above.
Hints/Notes:
-
This sample uses daily return data. Your results will differ from the sample output! This is expected. The daily mean return will be approximately 1/250 of the annual return, and the daily standard deviation will be approximately 1/sqrt(250) of the annual standard deviation.
-
Before trying to build this table, call each of the statistical functions and save the result in a variable. Print out the variables to ensure you know each function works.
-
Build the table one line at a time. This sample uses number formatting to limit the number of digits after the decimal point.
-
Your function will not have a return value, but will print out the report to the console.
-
The parameter
filenameswill be a list of CSV file names. The list will contain more than 1 file name, and your code must work with any length greater than 1.
- Use your function
Submitting Your Work
20 points; will be assignmed by code review
Use the link to GradeScope (left) to submit your work.
Be sure to name your files correctly!
Under the heading for Assignment 3, attach each of the required files to your submission.
When you upload the files, the autograder will test your functions/programs.
Warning: Beware of Global print statements
- The autograder script cannot handle
printstatements in the global scope, and their inclusion causes this error:
*   Why does this happen? When the autograder imports your file, the `print`
    statement(s) execute (at import time), which causes this error.

*   You can prevent this error by not having any `print` statements in the global scope.
    Instead, create an `if __name__ == '__main__':` section at the bottom of the file, and
    put any test cases/print statements in that controlled block. For example:

        if __name__ == '__main__':

            ## put test cases here:
            print('fv_lump_sum(0.05, 2, 100)', fv_lump_sum(0.05, 2, 100))

*   `print` statements inside of functions do not cause this problem.
Notes:
- You must upload your
.csv(stock price data files) as well as your.pyfiles. - You may resubmit multiple times, but only the last submission will be graded.