Assignment 9: Linear Algebra and Efficient Portfolios
Discussion on Monday 3/30/26
Workshop in class on Wednesday 4/1/26
Submission due by 9:00 p.m. on Friday 4/3/26.
Preliminaries
In your work on this assignment, make sure to abide by the collaboration policies of the course.
For each problem in this problem set, we will be writing or evaluating some Python code. You are encouraged to use the Spyder IDE which will be discussed/presented in class, but you are welcome to use another IDE if you choose.
If you have questions while working on this assignment, please post them on Piazza! This is the best way to get a quick response from your classmates and the course staff.
Programming Guidelines
-
Refer to the class Coding Standards for important style guidelines. The grader will be awarding/deducting points for writing code that comforms to these standards.
-
Every program file must begin with a descriptive header comment that includes your name, username/BU email, and a brief description of the work contained in the file.
-
Every function must include a descriptive docstring that explains what the function does and identifies/defines each of the parameters to the function.
-
Your functions must have the exact names specified below, or we won’t be able to test them. Note in particular that the case of the letters matters (all of them should be lowercase), and that some of the names include an underscore character (
_). -
If a function takes more than one input, you must keep the inputs in the order that we have specified.
-
You should not use any Python features that we have not discussed in class or read about in the textbook.
-
Your functions do not need to handle bad inputs – inputs with a type or value that doesn’t correspond to the description of the inputs provided in the problem.
-
You must test each function after you write it.
Warnings: Individual Work, Generative AI, and Academic Conduct!!
-
This is an individual assignment. You may discuss the problem statement/requirements, Python syntax, test cases, and error messages with your classmates. However, each student must write their own code without copying or referring to other student’s work.
-
It is strictly forbidden to use any code that you find from online websites including but not limited to as CourseHero, Chegg, or any other sites that publish homework solutions.
-
It is strictly forbidden to use any generative AI (e.g., ChatGPT, Claude, Gemini, CoPilot or any similar tools**) to write solutions for any assignment.
Students who submit work that is not authentically their own individual work will earn a grade of 0 on this assignment and a reprimand from the office of the Dean.
If you have questions while working on this assignment, please post them on Piazza! This is the best way to get a quick response from your classmates and the course staff.
Objective and Overview
Objective: Become familiar with the numpy, matplotlib, and pandas packages in Python.
Overview: In this assignment, you will develop some experience working with the
numpy, matplotlib, and pandas packages in Python. In particular, you will become
familiar with the numpy.arrays and numpy.matrix classes for linear algebra computations,
and with the the pandas.DataFrame object for managing time-series and panel data.
Finally, you will do some graphing using the matplotlib package.
Background: Financial datasets are often presented as time-series data. While it is entirely possible to process these data using regular Python lists, a number of toolkits have been implemented that provide substantially faster performance.
Important Reading: Numpy Quickstart Guide and PyPlot tutorial
This assignment uses the numpy numerical programming toolkit to perform linear algebra operations, as well as the matplotlib graphing toolkit.
To begin, you should read/skim the numpy quickstart tutorial, with a focus on the data types and syntax of numpy, and we will discuss some examples in class.
Next, read/skim the pyplot tutorial to gain an overview of what it does, and some of the plotting syntax, etc. We will disuss some examples in class.
Video Tutorials: Pandas
The following video tutorials introduce the *pandas* toolkit and
provides some examples of working with pandas data types.
We will discuss these and do additional examples in class together.
This video demonstrates using pandas to read a .csv data file and obtain
a pandas.DataFrame object containing the values from that file.
Task 1: Some linear algebra with numpy: bond pricing and anayltics
15 points; individual-only
Do this entire task in a file called a9task1.py.
-
Write the function
bond_price(times, cashflows, rate)that calculates and returns the price of a bond, given it’s series of cashflows and discount rate. The parameters are:timesis a list of the times at which the cashflows occur;
cashflowsis a list of the cashflows for this bond;
ris the periodic (not annual) discount rate.For example:
>>> times = [1,2,3]
>>> cashflows = [10,10,110]
>>> rate = 0.10
>>> bond_price(times, cashflows, rate)
99.99999999999997
>>> rate = 0.085
>>> bond_price(times, cashflows, rate)
103.8310335571048
This function must use linear algebra to calculate the price of the bond. The price of a bond is given by:

where
dis the series of discount factors, i.e.,1/(1+r)^t for t in times
andCis the series of cash flows.Notes:
-
You may not use a loop or accumulator in this function.
-
You may use a list comprehension to create the list of discount factors.
-
You will need to convert all parameters to
numpy.matrixtypes before doing the calculations, and you must return the result as afloat.
-
-
Write the function
bootstrap(cashflows, prices)to implement the bootstrap method. This function will take parameterscashflows, which is a matrix (2-dimensional list) containing the cashflows for some bonds, andpriceswhich is a column matrix (2-dimensional list) containing the prices of these bonds.We can find the prices of the implied zero-coupon bonds (i.e., discount factors) using this equation:

where
Pis a matrix containing the price of the bond,CFis the matrix of the bonds’ cashflows, anddis the matrix of implied discount factors.Example:
>>> CF = [[105,0,0],[6,106,0],[7,7,107]]
>>> B = [99.5, 101.25, 100.35]
>>> bootstrap(CF, B)
matrix([[ 0.94761905],
        [ 0.90154987],
        [ 0.8168768 ]])
Notes:
-
You may not use a loop or accumulator in this function.
-
You may use a list comprehension to create the list of discount factors.
-
You will need to convert all parameters to type
numpy.matrixtypes before doing the calculations, and you must return the result as anumpy.matrix.
-
-
Write the function
bond_duration(times, cashflows, rate)to calculate and return the duration metric for a bond. The parameters are:timesis a list of the times at which the cashflows occur;
cashflowsis a list of the cashflows for this bond;
ris the periodic (not annual) discount rate.This function must use linear algebra to calculate the price of the bond. The duration is calculated by:

where
Bis the price of the bond,tis annp.arrayof the times at which the bond’s cashflows occur,Cis anp.matrixof the bonds’ cashflows, andda
np.arrayof discount factors.For example:
>>> # example with normal (coupon) bond
>>> times = [1, 2, 3, 4, 5, 6, 7, 8, 9, 10]
>>> cashflows = [40.0, 40.0, 40.0, 40.0, 40.0, 40.0, 40.0, 40.0, 40.0, 1040.0]
>>> bond_duration(times, cashflows, 0.035) # 7% annual rate, with 2 payments/year
8.4723105333131112
All other things being equal, a bond with higher coupon payments will have lower duration than a bond with lower coupon payments.
>>> # another example with normal (coupon) bond
>>> times = [1, 2, 3, 4, 5, 6, 7, 8, 9, 10]
>>> cashflows = [70.0, 70.0, 70.0, 70.0, 70.0, 70.0, 70.0, 70.0, 70.0, 1070.0]
>>> bond_duration(times, cashflows, 0.035) # 7% annual rate, with 2 payments/year
7.843182123763313
And a zero-coupon bond (which pays only the maturity value in the future) will have a duration equal to its maturity:
>>> # example with a zero-coupon bond:
>>> times = [1, 2, 3, 4, 5, 6, 7, 8, 9, 10]
>>> cashflows = [0, 0, 0, 0, 0, 0, 0, 0, 0, 1000]
>>> bond_duration(times, cashflows, 0.035) # 7% annual rate, with 2 compounding periods/year
10.0
Notes:
-
You may not use a loop or accumulator in this function.
-
You may use a list comprehension to create the list of discount factors.
-
You will need to convert the parameters to
numpy.arraytypes before doing the calculations, and you must return the result as afloat.
-
Task 2: Efficient Portfolios and the Efficient Frontier
40 points; individual-only
questions (1, 2, 5, 7) are worth 4 points each; questions (3, 4, 6, 8) are 6 points each.
Harry Markowitz won the Nobel Prize for his work on understanding the risk-return trade-off in investments, and specifically the Efficient Frontier.
The Markowitz Efficient Frontier is the set of all efficient portfolios, i.e., portfolios that have give the highest expected return for a given level of risk (standard deviation). In this section, you will implement the fundamental calculations to find efficient (minimum variance) portfolios, as well as the global minimum variance portfolio.
The mathematics required for these calculations are explained in this excerpt from the book “Numerical Recipes”. A brief summary and the required formulas are given below.
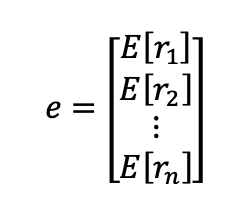
We assume a set of expected asset returns on n >= 2 assets, which we represent in
the matrix e:
Further, we know the weights of each asset within the portfolio p, and we can represent
the set of asset weights within that portfolio as the matrix w:
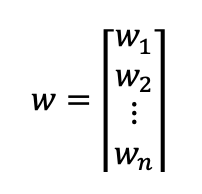
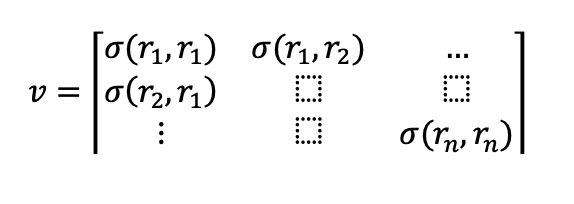
Finally, we assume that we know the covariances between the rates of return of all of
the assets in the portfolio, as represented by the variance-covariance matrix v:
Do this entire task in a file called a9task2.py.
You should include this import statement at the top of your file:
import numpy as np
-
Write the function
calc_portfolio_return(e, w)that calculates and returns the portfolio return (as afloat) for a portfolio ofn>= 2 assets. The parameters are:
eis a matrix of expected returns for the assets
wis a matrix of portfolio weights of the assets, which sums to 1.We calculate the expected return of the portfolio as:
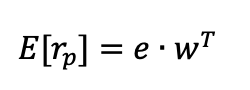
where:
eis vector (1 x N) of expected returns for the portfolio assets
wTis the transpose of the portfolio weights (N x 1)
E[r_p]is the expected return for the portfolioFor example:
>>> e = np.matrix([0.1, 0.11, 0.08])
>>> w = np.matrix([1,1,1]) / 3
>>> calc_portfolio_return(e, w)
0.09666666666666668
>>> # another example
>>> e = np.matrix([0.12, 0.05, 0.09])
>>> w = np.matrix([0.3, 0.4, 0.3])
>>> calc_portfolio_return(e, w)
0.083
Notes:
- The function must return the resulting rate of return as a
float.
- The function must return the resulting rate of return as a
-
Write the function
calc_portfolio_stdev(v, w)that calculates and returns the portfolio standard deviation (as afloat) for a portfolio ofn>= 2 assets. The parameters are:
vis a matrix of covariances among the assets, and
wis a matrix of portfolio weights of the assets, which sums to 1.We calculate the variance of the portfolio as:
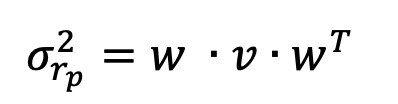
where:
wis the (1 x N) matrix of portfolio weights
vis the (N x N) variance-covariance matrix
wTis the transpose of the portfolio weights (N x 1)
σ^2 (r_p)is the variance of the portfolioAnd the standard deviation is the square-root of the variance.
For example:
>>> w = np.matrix([0.4, 0.3, 0.3])
>>> v = np.matrix([[0.2, 0, 0], [0, 0.1, 0], [0, 0, 0.15]])
>>> calc_portfolio_stdev(v, w)
0.23345235059857505
>>> # another example
>>> w = np.matrix([0.3, 0.5, 0.2])
>>> v = np.matrix([[0.2, 0.1, 0.5], [0.1, 0.1, 0.2], [0.5, 0.2, 0.3]])
>>> calc_portfolio_stdev(v, w)
0.4301162633521313
>>>
Notes:
- The function must return the resulting standard deviation as a
float.
- The function must return the resulting standard deviation as a
-
Write the function
calc_global_min_variance_portfolio(v)that returns the portfolio weights corresponding to the global minimum variance portfolio. That is, this function will find the portfolio with the absolute minimum variance that can be composed of the selected assets, wherevis the matrix of covariances among the assets.Given the set of portfolio assets and the covariances among these assets, there is a single best portfolio that results in the absolute minimum amount of portfolio variance (i.e., the lowest possible standard deviation of returns).
We calculate the global minimum variance portfolio as:
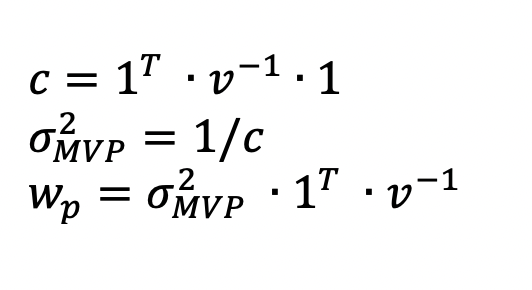
where:
vis the (N x N) variance-covariance matrix
1is a column vector of 1s, of the same length as v
σ^2(MVP)is the variance of the minimum variance portfolio (a scalar)
w_pis the vector (1 x N) of portfolio weights of the global minimum variance portfolioFor example:
>>> # first example:
>>> e = np.matrix([0.1, 0.11, 0.08])
>>> v = np.matrix([[0.2, 0, 0], [0, 0.1, 0], [0, 0, 0.15]])
>>> w = calc_global_min_variance_portfolio(v)
>>> w # these are the portfolio weights for the global minimum variance portfolio
matrix([[ 0.23076923,  0.46153846,  0.30769231]])
>>> # this is the rate of return on the global minimum variance portfolio
>>> calc_portfolio_return(e, w)
0.09846153846153845
>>> # this is the standard deviation on the global minimum variance portfolio
>>> calc_portfolio_stdev(v, w)
0.21483446221182986

>>> # second example
>>> e = np.matrix([0.12, 0.09, 0.07])
>>> v = np.matrix([[0.2, 0.1, 0.15], [0.1, 0.1, 0.4], [0.15, 0.4, 0.1]])
>>> w = calc_global_min_variance_portfolio(v)
>>> w # these are the portfolio weights for the global minimum variance portfolio
matrix([[ 0.6122449 ,  0.14285714,  0.24489796]])
>>> # this is the rate of return on the global minimum variance portfolio
>>> calc_portfolio_return(e, w)
0.10346938775510206
>>> # this is the standard deviation on the global minimum variance portfolio
>>> calc_portfolio_stdev(v, w)
0.41649656391752155
Notes:
-
The function must return the resulting portfolio as a
np.matrixof portfolio weights. -
Once we know the portfolio weights, we can use these to calculate the portfolio’s expected return and standard deviation.
-
-
Write the function
calc_min_variance_portfolio(e, v, r)that finds and returns the portfolio weights corresponding to the minimum variance portfolio for the required rate of returnr.
The parameters are:
eis a matrix of expected returns for the assets
vis a matrix of covariances among the assets.
ris the required rate of returnGiven the set of portfolio assets and the covariances among these assets, there is a single best portfolio that achieves the required rate of return
rat the minimum amount of protfolio variance (i.e., standard deviation).We calculate the minimum variance portfolio for the rate
ras:
where:
vis the (N x N) variance-covariance matrix
eis vector (1 x N) of expected returns for the portfolio assets
1is a row vector of 1s, of the same length as v
w_pis the vector (1 x N) of portfolio weights of the minimum variance portfolio corresponding to the expected rate of returnrExample 1 (no covariance among the assets):
>>> # consider these three assets and the covariance matrix:
>>> e = np.matrix([0.1, 0.11, 0.08])
>>> v = np.matrix([[0.2, 0, 0], [0, 0.1, 0], [0, 0, 0.15]])
>>> # find minimum variance portfolio for r = 0.09
>>> w = calc_min_variance_portfolio(e, v, 0.09)
>>> w # these are the portfolio weights
matrix([[ 0.21276596,  0.19148936,  0.59574468]])
>>> calc_portfolio_return(e, w)
0.08999999999999958
>>> calc_portfolio_stdev(v, w)
0.2568218191830864
>>>
>>> # find minimum variance portfolio for r = 0.10
>>> w = calc_min_variance_portfolio(e, v, 0.10)
>>> w # these are the portfolio weights
matrix([[ 0.23404255,  0.5106383 ,  0.25531915]])
>>> calc_portfolio_return(e, w)
0.09999999999999953
>>> calc_portfolio_stdev(v, w)
0.21635274585338046
>>>
>>> # find minimum variance portfolio for r = 0.11
>>> w = calc_min_variance_portfolio(e, v, 0.11)
>>> w # these are the portfolio weights
matrix([[ 0.25531915,  0.82978723, -0.08510638]])
>>> calc_portfolio_return(e, w)
0.10999999999999946
>>> calc_portfolio_stdev(v, w)
0.28806027738002005
Example 2 (with covariance among assets):
>>> # consider these three assets and the covariance matrix:
>>> e = np.matrix([0.12, 0.11, 0.08]])
>>> v = np.matrix([[0.3, 0.2, 0.1], [0.2, 0.25, 0.1], [0.1, 0.1, 0.2]])
>>> # find minimum variance portfolio for r = 0.09
>>> w = calc_min_variance_portfolio(e, v, 0.09)
>>> w # these are the portfolio weights
matrix([[0.05263158, 0.26315789, 0.68421053]])
>>> calc_portfolio_return(e, w)
0.08999999999999991
>>> calc_portfolio_stdev(v, w)
0.40065735459301577
>>>
>>> # find minimum variance portfolio for r = 0.10
>>> w = calc_min_variance_portfolio(e, v, 0.10)
>>> w # these are the portfolio weights
matrix([[0.26315789, 0.31578947, 0.42105263]])
>>> calc_portfolio_return(e, w)
0.09999999999999985
>>> calc_portfolio_stdev(v, w)
0.40392808114420775
>>>
>>> # find minimum variance portfolio for r = 0.11
>>> w = calc_min_variance_portfolio(e, v, 0.11)
>>> w # these are the portfolio weights
matrix([[0.47368421, 0.36842105, 0.15789474]])
>>> calc_portfolio_return(e, w)
0.10999999999999992
>>> calc_portfolio_stdev(v, w)
0.45014617508912375
Notes:
-
The function must return the resulting portfolio as a
np.matrixof portfolio weights. -
Once we know the portfolio weights, we can use these to calculate the portfolio’s expected return and standard deviation.
-
Note that as we change the required rate of return
r, the resulting portfolio weights change, to help achieve the minimum variance portfolio for this rate of return.
-
-
Write the function
calc_efficient_portfolios_stdev(e, v, rs)which finds a series of minimum variance portfolios and returns their standard deviations.
The parameters are:eis a matrix (1 x N) of expected returns for the assets
vis a matrix (N x N) of covariances among the assets.
rsis anumpy.array(1 x N) of rates of return for which to calculate the corresponding minimum variance portfolio’s standard deviationThis function should use a loop and an accumulator pattern, along with the other functions defined above, to develop the efficient (minimum variance) portfolios that correspond to the series of rates of return. This is best illustrated with an example.
>>> e = np.matrix([0.1, 0.11, 0.08])
>>> v = np.matrix([[0.2, 0, 0], [0, 0.1, 0], [0, 0, 0.15]])
>>> rs = np.linspace(0.07, 0.12, 10) # generate 10 steps between 0.07 and 0.12
>>> rs # these are the rates of return for which to find efficient portfolios
array([ 0.07      ,  0.07555556,  0.08111111,  0.08666667,  0.09222222,
        0.09777778,  0.10333333,  0.10888889,  0.11444444,  0.12      ])
>>> sigmas = calc_efficient_portfolios_stdev(e, v, rs)
r = 0.0700, sigma = 0.5198  w = [[ 0.17021277 -0.44680851  1.27659574]]
r = 0.0756, sigma = 0.4374  w = [[ 0.1820331  -0.26950355  1.08747045]]
r = 0.0811, sigma = 0.3597  w = [[ 0.19385343 -0.09219858  0.89834515]]
r = 0.0867, sigma = 0.2909  w = [[ 0.20567376  0.08510638  0.70921986]]
r = 0.0922, sigma = 0.2386  w = [[ 0.21749409  0.26241135  0.52009456]]
r = 0.0978, sigma = 0.2151  w = [[ 0.22931442  0.43971631  0.33096927]]
r = 0.1033, sigma = 0.2296  w = [[ 0.24113475  0.61702128  0.14184397]]
r = 0.1089, sigma = 0.2761  w = [[ 0.25295508  0.79432624 -0.04728132]]
r = 0.1144, sigma = 0.3418  w = [[ 0.26477541  0.97163121 -0.23640662]]
r = 0.1200, sigma = 0.4177  w = [[ 0.27659574  1.14893617 -0.42553191]]
>>> sigmas # the portfolio standard deviations corresponding to the rates of return rs
array([ 0.51981994,  0.4373548 ,  0.3597492 ,  0.29091849,  0.23858219,
        0.21513522,  0.22960548,  0.27609419,  0.34177644,  0.41769377])
Notes:
-
For each rate of return, there is a corresponding minimum variance portfolio and its associated standard deviation.
-
The lines showing
r,sigma, andware print statements generated inside the loop. -
The function must return a sequence of standard deviations as a
np.array. Use the accumulator pattern to build this array inside a loop.
-
Reading stock price data from files
In the next part of this task, you will write some functions to read stock price
data from .csv files, and use that data to produce a minimum variance portfolio.
The files follow the format from Yahoo Finance, and you can obtain your own
data files using the instructions contained in Assignment 3 Task 2.
We will use the toolkit called pandas to read these data files and manipulate
the data. pandas will be briefly discussed during workshop time this week, and
in more detail the following week.
Here are links to the data files used in the examples below:
AAPL.csv
DIS.csv
GOOG.csv
HSY.csv
KO.csv
WMT.csv
-
Write the function
get_stock_prices_from_csv_files(symbols)to obtain apandas.DataFramecontaining historical stock prices for several stocks. The parametersymbolswill be a list of stock symbols, and the return value will be apandas.DataFramecontaining the monthly stock prices for each of those stock symbols, for the period of dates given in the CSV files.For example, consider the following 2 data files containing stock price data for two stocks:
File: AAPL.csvDate,Open,High,Low,Close,Adj Close,Volume 11/1/07,26.942858,27.525715,21.518572,26.031429,23.419334,6549947600 12/1/07,25.98,28.994286,25.284286,28.297142,25.457693,4313169700 1/1/08,28.467142,28.608572,18.02,19.337143,17.396778,8793472100 2/1/08,19.462856,19.512857,16.491428,17.860001,16.067854,6216488600 3/1/08,17.777143,20.82,16.857143,20.5,18.442949,5731818400 4/1/08,20.9,25.714285,20.515715,24.85,22.356453,5696745600 5/1/08,24.994286,27.462856,24.571428,26.964285,24.258581,4647053600File: DIS.csvDate,Open,High,Low,Close,Adj Close,Volume 11/1/07,34.509998,34.709999,30.68,33.150002,28.840109,219617300 12/1/07,33.060001,33.5,31.709999,32.279999,28.083218,193431800 1/1/08,32.32,32.630001,26.299999,29.84,26.240885,311584700 2/1/08,30.75,33.23,30.049999,32.41,28.500908,273015700 3/1/08,32.610001,32.709999,30.049999,31.379999,27.595139,228129500 4/1/08,31.52,33.029999,29.57,32.43,28.518496,253682300 5/1/08,32.450001,35.02,32.419998,33.599998,29.547377,265545100This function will process these files and return the
pandas.DataFrame.Getting started
You should place your stock price
.csvfiles in the same directory as your python code file. Make sure to use the name format:SYMBOL.csvfor each file. The following code will help you get started to read the data files based on a list of stock symbols:def get_stock_prices_from_csv_files(symbols): # for each stock symbol, create the appropriate file name to read: for symbol in symbols: fn = f"./{symbol}.csv" You will need to process all of the data files, one at a time in a loop.
Your first objective is to obtain a single
pandas.DataFrameobject containing theDateandAdj Closeprice for each stock, for example, this:Date 2007-11-01 23.419334 2007-12-01 25.457693 2008-01-01 17.396778 2008-02-01 16.067854 2008-03-01 18.442949
Next, you should use an accumulator pattern to build a new
DataFrameby iteratively joining the data for each stock into a single dataset. Use the stock symbol as the key for the column.Specifically, you may use the function
pandas.concat(parts), which will concatenate together a collection (e.g., a list) ofpd.Seriesobjects, so long as they have a matching index (e.g., the date).For example, this
DataFramecontains the data from all stocks above:AAPL DIS GOOG KO WMT 2011-01-01 43.610184 35.478046 298.240234 25.634483 46.988205 2011-02-01 45.395367 39.923080 304.718109 26.070902 43.560680 2011-03-01 44.791302 39.329807 291.484161 27.057940 43.619331 2011-04-01 44.999500 39.338928 270.292023 27.714268 46.397697 2011-05-01 44.703896 37.997211 262.800720 27.447216 46.600239
Hints:
-
It will be helpful to build this code step-by-step at the command prompt, and examine the intermediary results as you go. Remeber you can use
pandas.DataFrame.head()to view the first 5 rows of the data frame. -
You may assume that the files have the name format
SYMBOL.csv(replacingSYMBOLwith the actual stock symbol) and that the data in the files all correspond to the same time periods, as in the example above. -
We will test this code with some different stock returns, so your code must work with any CSV data file, so long as they follow the same data format.
-
-
Write the function
get_stock_returns_from_csv_files(symbols), which will return a singlepandas.DataFrameobject containing the stock returns. Begin by calling your functionget_stock_prices_from_csv_files(symbols)to obtain stock prices. Manipulate the data frame to convert from stock prices into stock returns. The result of this function is to return a singlepandas.DataFrameobject containing the stock returns.It will have the stock symbols as column names and the dates as index values. Here is an example:
>>> symbols = ['AAPL', 'DIS', 'GOOG', 'KO', 'WMT'] >>> # note that the function also produces this small printout for debugging >>> returns = get_stock_returns_from_csv_files(symbols) /Users/azs/Downloads/AAPL.csv /Users/azs/Downloads/DIS.csv /Users/azs/Downloads/GOOG.csv /Users/azs/Downloads/KO.csv /Users/azs/Downloads/WMT.csv >>> returns.head() AAPL DIS GOOG KO WMT 2007-11-01 NaN NaN NaN NaN NaN 2007-12-01 0.087037 -0.026244 -0.002193 -0.006391 -0.007724 2008-01-01 -0.316640 -0.065603 -0.183924 -0.038618 0.072348 2008-02-01 -0.076389 0.086126 -0.165019 -0.009153 -0.022664 2008-03-01 0.147817 -0.031780 -0.065177 0.041225 0.062311
Hints:
-
We cannot calculate returns for the first period. Instead, set the first row of returns to be the value
float('Nan'), i.e, “not a number.” -
You may assume that the files exist, and that the data in the files all correspond to the same time periods, as in the example above.
-
We will test this code with some different stock returns, so your code must work with any CSV data file, so long as they follow the same data format.
-
-
Write the function
get_covariance_matrix(returns), which generates a covariance matrix for the stock returns inreturns. The parameterreturnwill be apandas.DataFrameobject, i.e., the sametypeas from theget_stock_returns_from_csv_files(symbols)function above.For example:
>>> symbols = ['AAPL', 'DIS', 'GOOG', 'KO', 'WMT'] >>> # note that the function also produces this small printout for debugging >>> returns = get_stock_returns_from_csv_files(symbols) /Users/azs/Downloads/AAPL.csv /Users/azs/Downloads/DIS.csv /Users/azs/Downloads/GOOG.csv /Users/azs/Downloads/KO.csv /Users/azs/Downloads/WMT.csv >>> covar = get_covariance_matrix(returns) >>> covar AAPL DIS GOOG KO WMT AAPL 0.007775 0.002384 0.003823 0.001165 0.000468 DIS 0.002384 0.004245 0.002378 0.001221 0.000410 GOOG 0.003823 0.002378 0.006470 0.000995 0.000348 KO 0.001165 0.001221 0.000995 0.001941 0.000726 WMT 0.000468 0.000410 0.000348 0.000726 0.002221 >>>
Notes:
-
Your function will return a
pandas.DataFrameobject (dimensionsn * n), containing the covariance matrix for the returns of these stocks. -
For each element of the covariance matrix, you will calculate the covariance between the returns of two stocks. You can do either of two ways:
(a) by manipulating the column data as aDataFrame, or
(b) by converting the column data into a list, and then re-using the functioncovariance(x,y)from Assignment 3 Task 1.Either way will be fine, but pick only one!
Here we continue this example, and re-use the functions (from above) to find the global minimum variance portfolio among these stocks:
>>> symbols = ['AAPL', 'DIS', 'GOOG', 'KO', 'WMT'] >>> returns = get_stock_returns_from_csv_files(symbols) >>> covar = get_covariance_matrix(returns) >>> >>> # convert to np.matrix types: >>> v = np.matrix(covar) >>> e = np.matrix(returns.mean()) >>> w = calc_global_min_variance_portfolio(v) # portfolio weights: matrix([[ 0.0160424 , 0.10065317, 0.06856947, 0.39892614, 0.41580881]]) >>> calc_portfolio_return(e, w) 0.008553022022309877 >>> calc_portfolio_stdev(v, w) 0.0358612976659109
-
Task 3: Graphing with pandas and mathplotlib.
25 points; individual-only
In this task, you will create several graphs using the packages matplotlib and pandas.
Do this entire task in a file called a9task3.py.
You must include these import statement at the top of your file:
import numpy as np import datetime as dt import matplotlib.pyplot as plt
In addition, you will need to import some functions that you have previously written.
Use these additional import statements:
from a9task2 import * # efficient frontier
-
Write the function
plot_stock_prices(symbols), which creates a graph of the historical stock prices for several stocks. This function should take a parameter which is a list of stock symbols. For each stock symbol, the function will expect a.csvfile containing stock price data (i.e., from Yahoo Finance), with monthly stock prices, for example the data files above.For example, this graph was created using this function:

Example function call:
symbols = ['AAPL', 'DIS', 'GOOG', 'KO', 'WMT'] plot_stock_prices(symbols)Re-use your
get_stock_prices_from_csv_files(symbols)function froma9task2to obtain apandas.DataFramecontaining the stock prices.For example, this dataset contains the data from all stocks above:
AAPL DIS GOOG KO WMT 2011-01-01 43.610184 35.478046 298.240234 25.634483 46.988205 2011-02-01 45.395367 39.923080 304.718109 26.070902 43.560680 2011-03-01 44.791302 39.329807 291.484161 27.057940 43.619331 2011-04-01 44.999500 39.338928 270.292023 27.714268 46.397697 2011-05-01 44.703896 37.997211 262.800720 27.447216 46.600239Create a plot with stock prices on the vertical axis (x-axis), and the dates on the horizontal axis (y-axis).
Add a title to the plot.
Show the plot.
-
One of the problems with the graph produced in
plot_stock_prices(symbols)is that one of the stock’s prices (GOOG) is much higher than any of the others (in dollars), so it’s hard to see the detail about how they performed relative to each other. A better visualization would be to show the cumulative change in price since the starting point.Write the function
plot_stock_cumulative_change(symbols), which creates a graph of the cumulative stock returns for several stock. This function should take a parameter which is a list of stock symbols. For each stock symbol, the function will expect a.csvfile containing stock price data (i.e., from Yahoo Finance), with monthly stock prices, for example the data files above.For example, this graph was created using this function:

Example function call:
    symbols = ['AAPL',  'DIS', 'GOOG', 'KO', 'WMT']
    plot_stock_cumulative_change(symbols)
Re-use your
get_stock_prices_from_csv_files(symbols)function froma9task2to obtain apandas.DataFramecontaining the stock prices.Create a new
pandas.DataFramecontaining the cumulative change in price since the earliest period.For example, this dataset contains the data from all stocks above:
                    AAPL       DIS      GOOG        KO       WMT
    2011-01-01  1.000000  1.000000  1.000000  1.000000  1.000000
    2011-02-01  1.040935  1.125290  1.021720  1.017025  0.927056
    2011-03-01  1.027084  1.108567  0.977347  1.055529  0.928304
    2011-04-01  1.031858  1.108825  0.906290  1.081132  0.987433
    2011-05-01  1.025079  1.071006  0.881171  1.070715  0.991743
Create a plot with cumulative change in prices on the vertical axis (x-axis), and the dates on the horizontal axis (y-axis).
Add a title on the plot.
Show the plot.
-
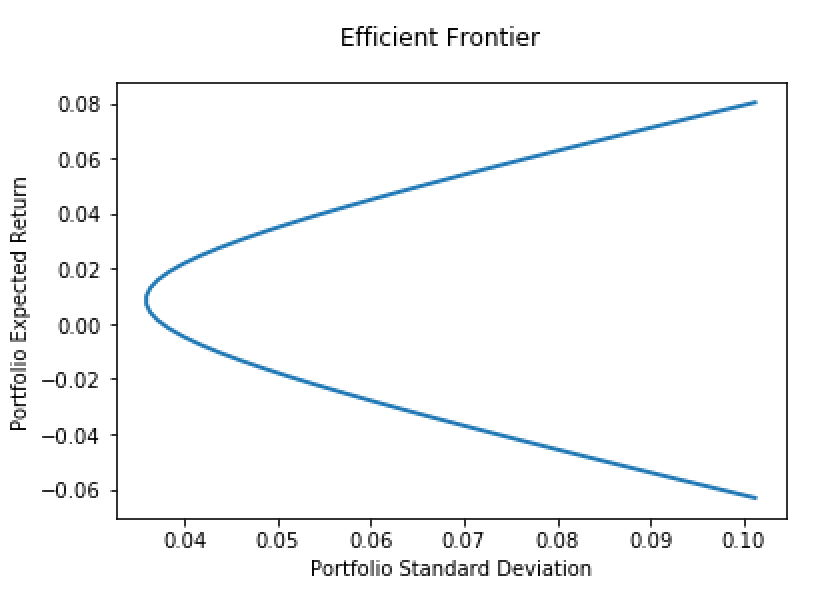
Write the function
plot_efficient_frontier(symbols)to create a graph of the efficient frontier (the set of minimum variance portfolios) that can be achieved using a small set of assets.Consider this sample graph, which processes the file stocks shown above and produces the efficient frontier of portfolios of these stocks:
*Notes:
-
You have written most of the code required for this function in Task 2 (above). Re-use the functions
get_stock_returns_from_csv_files(symbols)andget_covariance_matrix(returns)to obtain the stock symbols and returns, and covariance matrix. -
Calculate the average return for each stock, and create a
np.matrixof returns. -
Use the function
np.linspace(start, stop)to create a set of desired rates of return (rs) at which to find efficient portfolios. Hint: I used the global minimum variance portfolio’s return, and then created a range of possible returns above/below the minimum variance portfolio’s return. -
Use your
calc_efficient_portfolios_stdev(e, v, rs)function to calculate the standard deviations of the set of efficient portfolios, corresponding to the desired rates of returnrs. -
Plot the resulting efficient frontier, using the
plt.plot(x, y, '-')function, where thexandyparameters arenp.arrayobjects.
-
Take a screen shot of your graphs!
The Gradescope autograder cannot display/test your graphs. Instead, we will attempt to run your code manually to test the graphing.
As a backup, please take screen shots of your graphs and save as a single .pdf
file called a8graphs.pdf and attach this file to Gradescope.
To take a screen shot:
-
On Mac: use the keyboard sequence
Command-Shift-4, and then drag the cross-hairs to include the region you want to include. The image will be saved to your desktop. Create a Word document and drag your images into the document, then save as.pdf. -
On Windows: use the keyboard sequence
Ctrl-PrintScreen, and then paste Create a Word document and paste your images into the document, then save as.pdf.
Submitting Your Work
20 points; will be assignmed by code review
Use the link to GradeScope (left) to submit your work.
Be sure to name your files correctly!
Under the heading for Assignment 10, attach these 4 required files*:
a9task1.py, a9task2.py, a9task3.py, and a8graphs.pdf.
When you upload the files, the autograder will test your functions/programs.
Warning: Beware of Global print statements
- The autograder script cannot handle
printstatements in the global scope, and their inclusion causes this error:

*   Why does this happen? When the autograder imports your file, the `print`
    statement(s) execute (at import time), which causes this error.

*   You can prevent this error by not having any `print` statements in the global scope.
    Instead, create an `if __name__ == '__main__':` section at the bottom of the file, and
    put any test cases/print statements in that controlled block. For example:

        if __name__ == '__main__':

            ## put test cases here:
            print('fv_lump_sum(0.05, 2, 100)', fv_lump_sum(0.05, 2, 100))

*   `print` statements inside of functions do not cause this problem.
Notes:
- You may resubmit multiple times, but only the last submission will be graded.